
Lightweight Data Transformations in Fabric: A duckrun Demo

Are your tables in OneLake in the billions of rows? If not, Spark might be a hammer that’s too big for your nails. For focused datasets that aren’t mission-critical, single-process tools like DuckDB can deliver the same value while using just a sliver of capacity—especially valuable when your warehouse or SQL endpoints are already heavily utilized.
In this post, we’ll explore transforming a NYC Open Data collisions data set using duckrun, which simplifies the orchestration, testing, and documentation of delta lake tables in Fabric (kudos to Mimoune Djouallah for building it).
Currently, duckrun functions as both a Fabric notebook utility for reading and writing delta tables with DuckDB SQL and a dbt adapter. This post focuses on the latter—how to use it as a single-process transformation tool that applies software development best practices to your data work.
Disclaimer:
duckrunis an open-source library with only one maintainer; it makes no guarantees and is explicit about this. While its utility is clear and value can be high, you should approach its use with caution and avoid applying it in production scenarios, or at least ones that are mission critical. If you do use it, plan to test, test, test and ensure you have other options at the ready.
Prerequisites
Before getting started, you’ll need a few things in addition to an empty Fabric workspace:
azcopyto sync your dbt code into OneLake (or simply upload directly via the lakehouse UI)- An Azure DevOps or GitHub account to connect to your Fabric workspace
The complete code for this walkthrough is available in this GitHub repo. Clone it and update the workspace and lakehouse GUIDs to match your environment:

Understanding dbt Structure
Since duckrun wraps dbt-duckdb, your project follows standard dbt conventions: SQL files organized in a directory structure and contextualized with YAML configuration. Unlike notebook-based transformations, dbt projects keep code modular and well-organized.
The tree structure below shows a typical dbt project structure. The key directories are:
- macros: Reusable SQL snippets you want to repeat across your project
- models: Your transformation SQL files, organized into layers:
- staging: Initial transformations on raw data (can have subdirectories like
bronze) - intermediate: Views or materialized tables used by downstream models
- marts: Final business logic tables
- staging: Initial transformations on raw data (can have subdirectories like
├── macros
│   ├── create_int_sk.sql
│   └── generate_schema_name.sql
├── models
│   ├── intermediate
│   │   ├── collision_reason.sql
│   │   ├── collision_vehicle_type.sql
│   │   └── schema.yml
│   ├── marts
│   │   ├── bridge_reason.sql
│   │   ├── bridge_vehicle_type.sql
│   │   ├── dim_date.sql
│   │   ├── dim_location.sql
│   │   ├── dim_reason.sql
│   │   ├── dim_vehicle_type.sql
│   │   ├── fact_collision.sql
│   │   └── schema.yml
│   └── staging
│       ├── bronze
│       │   └── collisions.sql
│       └── schema.yml
├── dbt_project.yml
└── profiles.yml
Configuration Files
The three critical YAML files are:
-
profiles.yml: Tells
duckrunwhere to write your model outputs. Use environment variables for flexible multi-environment deployments:collisions_warehouse: target: dev outputs: dev: type: duckrun schema: cdw root_path: "{{ env_var('TARGET_LH_PATH') }}/Tables" -
dbt_project.yml: Determines which profile to use and sets configuration like schema names for each modeling layer
-
schema.yml: Defines data sources, tests, and documentation for your models. Here’s how to reference external data in your lakehouse:
sources:
  - name: bronze_lakehouse
    description: "Raw data from NYC Open Data collisions dataset"
    tables:
      - name: collisions
        description: "Raw collisions table. Staging normalizes and documents columns."
        meta:
          plugin: duckrun
          format: csv
          location: "{{ env_var('TARGET_LH_PATH') }}/Files/nyc-open-data/collisions.csv"
Writing Your Transformations
Your SQL transformations use DuckDB SQL with Jinja templating to manage dependencies. The source() and ref() functions link to your defined sources and upstream models:
-- You don't need the schema config in every model, unless you want a custom schema name
-- This is handled by the macro in the macros directory

{{ config(schema='staging') }}

-- silver query
SELECT
  "CRASH DATE" AS crash_date,
  CAST("CRASH TIME" AS VARCHAR) AS crash_time,
  CAST("CRASH DATE" + "CRASH TIME" AS TIMESTAMPTZ) AS crash_timestamp,
  CAST(LATITUDE AS DECIMAL(9,6)) AS latitude,
  CAST(LONGITUDE AS DECIMAL(9,6)) AS longitude,
  LOCATION AS location,
  BOROUGH AS borough,
  IFNULL(UPPER("ON STREET NAME"),'STREET UNKNOWN') AS on_street_name,
  IFNULL(UPPER("CROSS STREET NAME"),'CROSS STREET UNKNOWN') AS cross_street_name,
  IFNULL(UPPER("OFF STREET NAME"),'OFF STREET UNKNOWN') AS off_street_name,
  "NUMBER OF PERSONS INJURED" AS number_of_persons_injured,
  "NUMBER OF PERSONS KILLED" AS number_of_persons_killed,
  "NUMBER OF PEDESTRIANS INJURED" AS number_of_pedestrians_injured,
  "NUMBER OF PEDESTRIANS KILLED" AS number_of_pedestrians_killed,
  "NUMBER OF CYCLIST INJURED" AS number_of_cyclist_injured,
  "NUMBER OF CYCLIST KILLED" AS number_of_cyclist_killed,
  "NUMBER OF MOTORIST INJURED" AS number_of_motorist_injured,
  "NUMBER OF MOTORIST KILLED" AS number_of_motorist_killed,
  UPPER("CONTRIBUTING FACTOR VEHICLE 1") AS contributing_factor_vehicle_1,
  UPPER("CONTRIBUTING FACTOR VEHICLE 2") AS contributing_factor_vehicle_2,
  UPPER("CONTRIBUTING FACTOR VEHICLE 3") AS contributing_factor_vehicle_3,
  UPPER("CONTRIBUTING FACTOR VEHICLE 4") AS contributing_factor_vehicle_4,
  UPPER("CONTRIBUTING FACTOR VEHICLE 5") AS contributing_factor_vehicle_5,
  COLLISION_ID AS collision_id,
  UPPER("VEHICLE TYPE CODE 1") AS vehicle_type_code_1,
  UPPER("VEHICLE TYPE CODE 2") AS vehicle_type_code_2,
  UPPER("VEHICLE TYPE CODE 3") AS vehicle_type_code_3,
  UPPER("VEHICLE TYPE CODE 4") AS vehicle_type_code_4,
  UPPER("VEHICLE TYPE CODE 5") AS vehicle_type_code_5
FROM {{ source('bronze_lakehouse', 'collisions') }};
Deploying Your dbt Project to Fabric
With your dbt project properly structured, copy it to the files section of your lakehouse. I prefer azcopy sync for iterative development:
export DBT_LAKEHOUSE_URL="https://onelake.dfs.fabric.microsoft.com/$DUCKRUN_WORKSPACE_ID/$DUCKRUN_LH_ID/Files/dbt"

azcopy sync "./dbt" "$DBT_LAKEHOUSE_URL" \
    --recursive=true \
    --delete-destination=true \
    --trusted-microsoft-suffixes "fabric.microsoft.com"
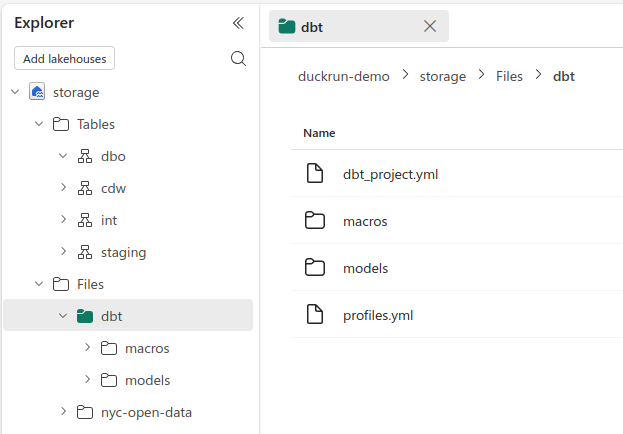
Your dbt directory is now ready to be accessed from a Fabric notebook:
Running dbt from Your Fabric Notebook
Your Fabric notebook acts as a simple orchestrator. It needs to:
- Install
duckrun - Execute your dbt project
- Report success or failure
- Generate documentation
Install duckrun and restart the kernel:
!pip install -q duckrun --upgrade
notebookutils.session.restartPython()
Then run your dbt project:
import os
from dbt.cli.main import dbtRunner, dbtRunnerResult

workspace = "<your-workspace-id>"
lh_art_id = "<your-lakehouse-artifact-id>"
os.environ["TARGET_LH_PATH"] = f"abfss://{workspace}@onelake.dfs.fabric.microsoft.com/{lh_art_id}"
dbt_project_dir = "/lakehouse/default/Files/dbt"

dbt = dbtRunner()

cli_args = [
    "build",
    "--project-dir", dbt_project_dir,
    "--profiles-dir", dbt_project_dir
]

res: dbtRunnerResult = dbt.invoke(cli_args)

for r in res.result:
    print(f"{r.node.name}: {r.status}")
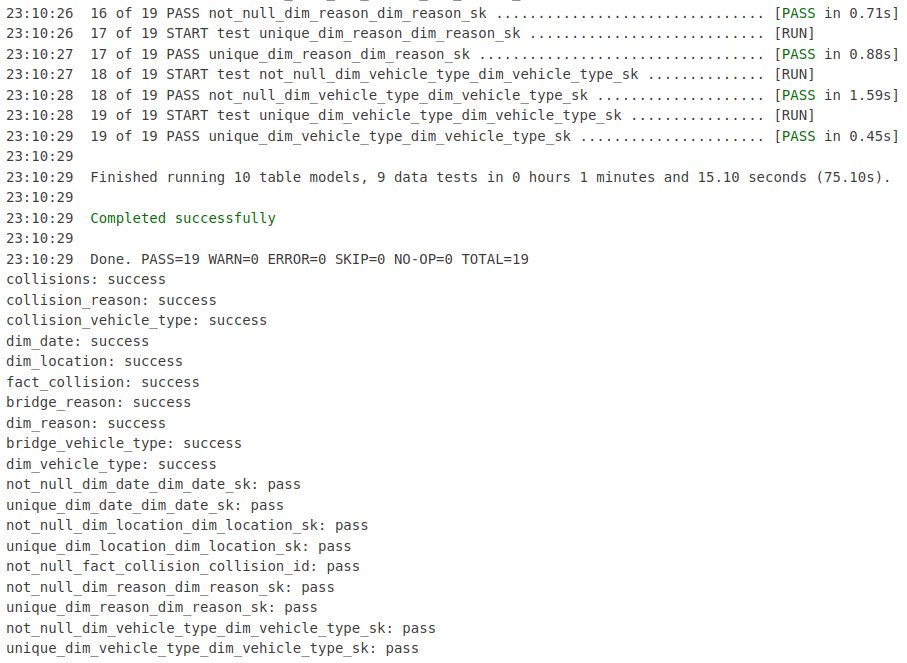
With everything configured correctly and no SQL or test errors, your run completes successfully:
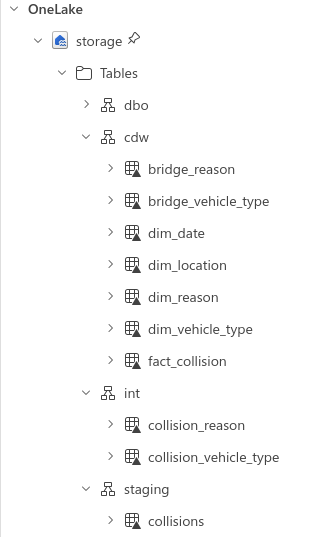
Your tables are now organized into the schemas you specified, ready for downstream analytics:
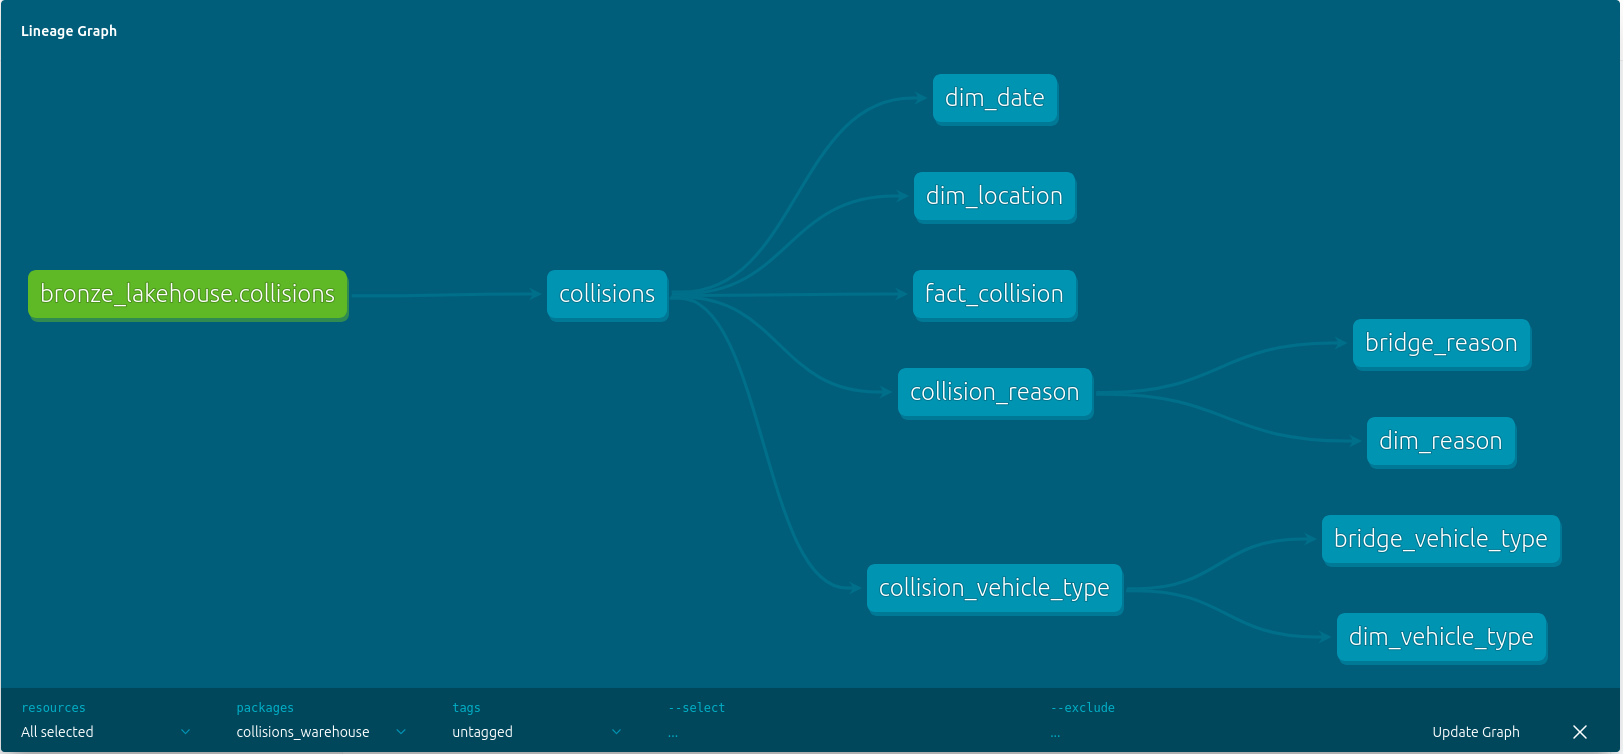
The file at dbt/target/static_index.html will be created, where you can access a lineage graph from within the dbt documentation interface:
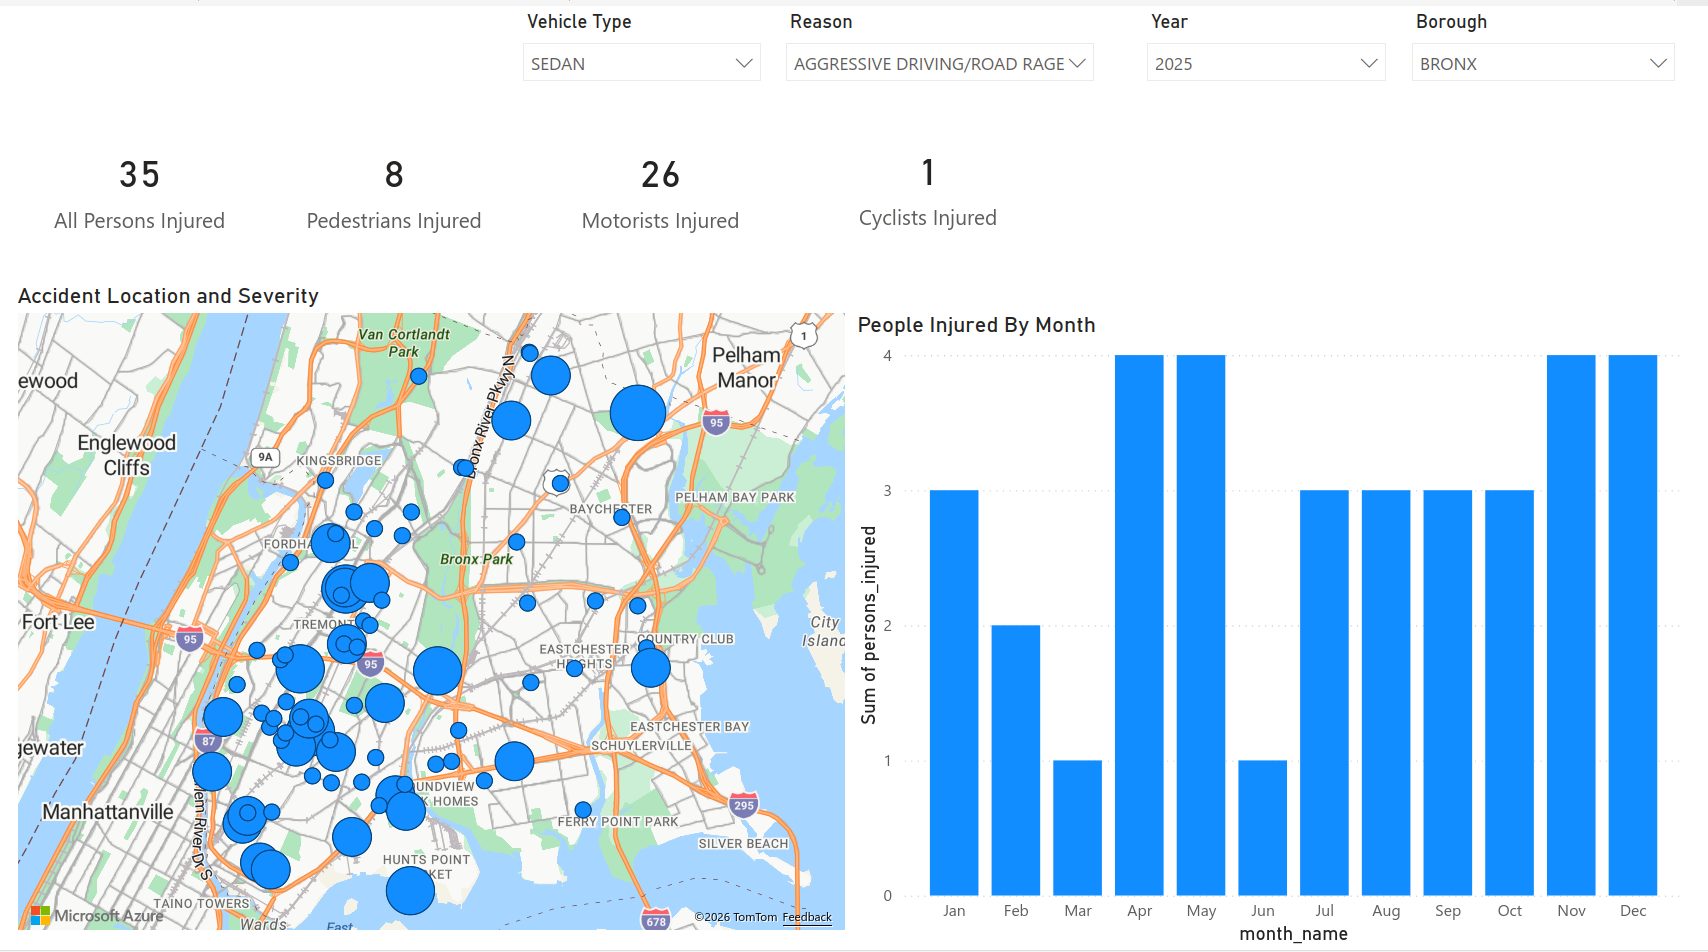
Load these into a semantic model and visualize with your favorite BI tool:
Wrapping Up
duckrun brings a mature feature set to a Fabric-specific need: transforming data with DuckDB SQL and materializing results as delta tables. You get organization, testing, tracing, and documentation that notebooks alone can’t provide.
If a simple query plus write_deltalake() works for your use case, you probably don’t need duckrun. However, for moderately complex transformations that warrant more structure, it’s worth having in your toolkit.
5 Ways to Cut Your Microsoft Fabric Spend

If you’ve been stunned by your Azure bill climbing due to Fabric capacity costs, you’re not alone. “Pay-as-you-go” sounds flexible, but it can sneak up on you like any cloud service. You’ll foot the bill for idle time unless you take control. These five strategies will help trim costs without sacrificing productivity. We’ll walk through each, with practical tips drawn from real usage patterns.
1. Pause When You’re Not Using It
Pay-as-you-go in Fabric isn’t truly “pay for what you use”. It mirrors Azure’s “always-on” metering until you hit pause. If your workloads are 9-to-5 or bursty, leaving capacity running overnight or over weekends means you’re paying full price for unused capacity. This is particularly important as your capacity size increases. The fix is simple: pause your capacity via the Fabric admin portal or automate it to cap costs when the capacity is not being used (I plan to cover that automation in another post).
2. Pick the Right Capacity Size
Starting with an oversized SKU like F64 when F8 would do is a common mistake. It’s a bit like renting a semi-truck for grocery runs. Fabric’s built-in Capacity Metrics app is your best friend here. It tracks CU (Capacity Unit) usage, showing peaks and idle time. If you’re consistently under 50% utilization, consider dropping to the next SKU down (e.g. from F16 to F8) and monitor for a week or so. It takes a couple clicks in the Azure portal and can literally cut your costs in half.
3. Leverage Autoscale for Bursty Jobs
For Spark workloads with infrequent spikes, a fixed large capacity just to handle bursts is overkill. You’re paying premium for rare events. In the Fabric admin portal, enable autoscale billing for Spark, which lets compute flex up during peaks and down to base levels otherwise, billing truly only for what you consume. It’s perfect for ETL jobs that hit hard a few times per day but idle most of the time. As of the time of this post, autoscale billing for Fabric Warehouse is planned but not yet available.

4. Optimize Your Workloads Ruthlessly
Inefficient queries are the silent killers of Fabric budgets. Poorly tuned Spark jobs or Warehouse scans can burn CUs like wildfire. Dive into the Capacity Metrics app or query logs to spot consumption bottlenecks, then refactor: switch to incremental loads, be intentional about partitions, or adjust broadcast join behavior. Here’s a bit of uncommon knowledge: for lighter tasks, you can ditch full Spark for Python-only notebooks with DuckDB. It’s in-memory, super fast, pre-installed and uses a fraction of the CUs since the notebooks are capped at 2 vCores and 16GB of memory by default (you can increase this if you need more).
5. Switch to Reserved Capacity Long-Term
If pausing doesn’t make sense for your workloads and Fabric is a core part of your analytics stack, the flexibility of pay-as-you-go comes at a premium. You’ll be leaving up to 41% in savings on the table. Commit to a 1 or 3 year reserved capacity for steady, 24/7 workloads like production pipelines, and pocket the savings. Once committed, cancellation isn’t really an option and pausing the capacity has no cost benefits, so baseline your usage first with metrics.
All in all, these tweaks can turn your Fabric experience from a budget black hole into a lean machine. Start with metrics monitoring with the Capacity Metrics app as it’s free insight that pays dividends. Experiment small, measure everything, and scale smart; your wallet (and your reputation with Finance) will thank you.